12.7 Modified PVAF approach and mesa plot
To address the first limitation, Nájera et al. (2019) conducted a series of simulation study and found that the best cutoff is affected by many factors, including item quality, sample size and test length. They suggested an optimal cutoff from these factors: \[\begin{equation} \text{logit}(\epsilon)=-.405+2.867\text{[Item quality]}+4.84\times10^{-4}N-3.316\times10^{-3}J \end{equation}\] where \(N\) and \(J\) are sample size and test length, respectively.
In the GDINA R package, this procedure can be carried out by specifying eps=-1.
Code
mPVAF <- Qval(mod1, method = "PVAF", eps = -1)
mPVAF
##
## Q-matrix validation based on PVAF method
##
## Suggested Q-matrix:
##
## A1 A2 A3 A4 A5
## 1 1 0 0 0 0
## 2 0 1 0 0 0
## 3 0 0 1 0 0
## 4 0 0 0 1 0
## 5 0 0 0 0 1
## 6 1 0 0 0 0
## 7 0 1 0 0 0
## 8 0 0 1 0 0
## 9 0 0 0 1 0
## 10 0 0 0 0 1
## 11 1 1 0 0 0
## 12 1 0 1 0 0
## 13 1 0 0 1 0
## 14 1 0 0 0 1
## 15 0 1 1 0 0
## 16 0 1 0 1 0
## 17 0 1 0 0 1
## 18 0 0 1 1 0
## 19 0 0 1 0 1
## 20 0 0 0 1 1
## 21 1 1 1 0 0
## 22 1 1 0 1 0
## 23 1 1 0 0 1
## 24 1 0 1 1 0
## 25 1 0 1 0 1
## 26 1 0 0 1 1
## 27 0 1 1 1 0
## 28 0 1 1 0 1
## 29 0 1 0 1 1
## 30 0* 0* 1* 1 1*
## Note: * denotes a modified element.Another solution is the mesa plot.
Code
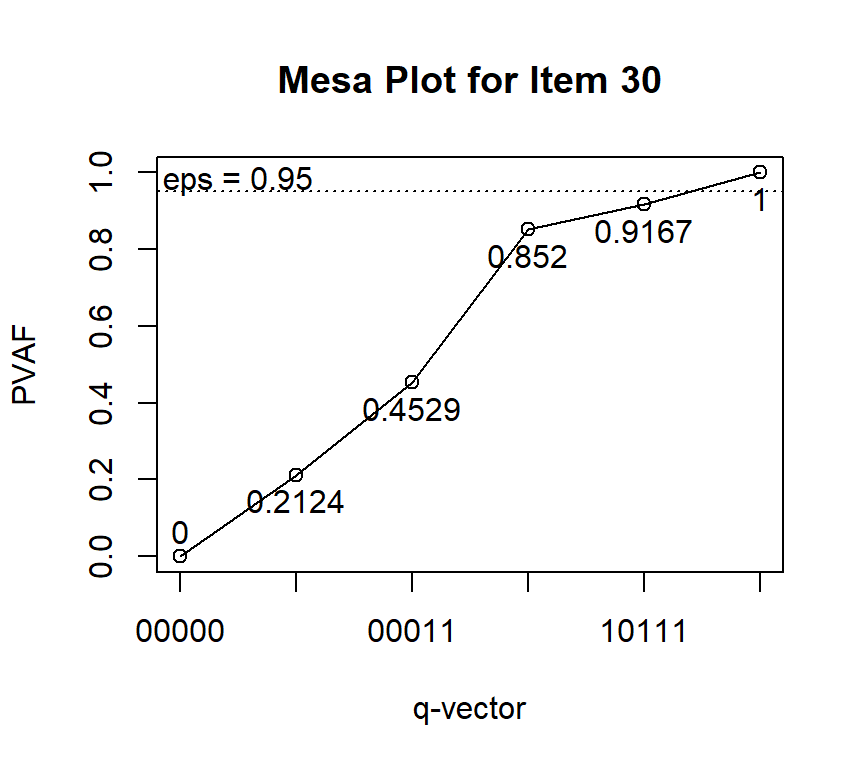
plot(PVAF, item = 30)
The mesa plot is a line chart, where the x-axis is the q-vectors with the highest PVAF for different numbers of required attributes, whereas the y-axis gives the corresponding PVAFs. Note that 0=(0,0,0) is not a valid q-vector, but is still shown on the x-axis for reference. The mesa plot is similar to the scree plot in factor analysis, and the q-vector on the edge of the “mesa” is believed the correct q-vector for the item (de la Torre & Ma, 2016). This makes specifying a cutoff for PVAF as in de la Torre & Chiu (2016) unnecessary.